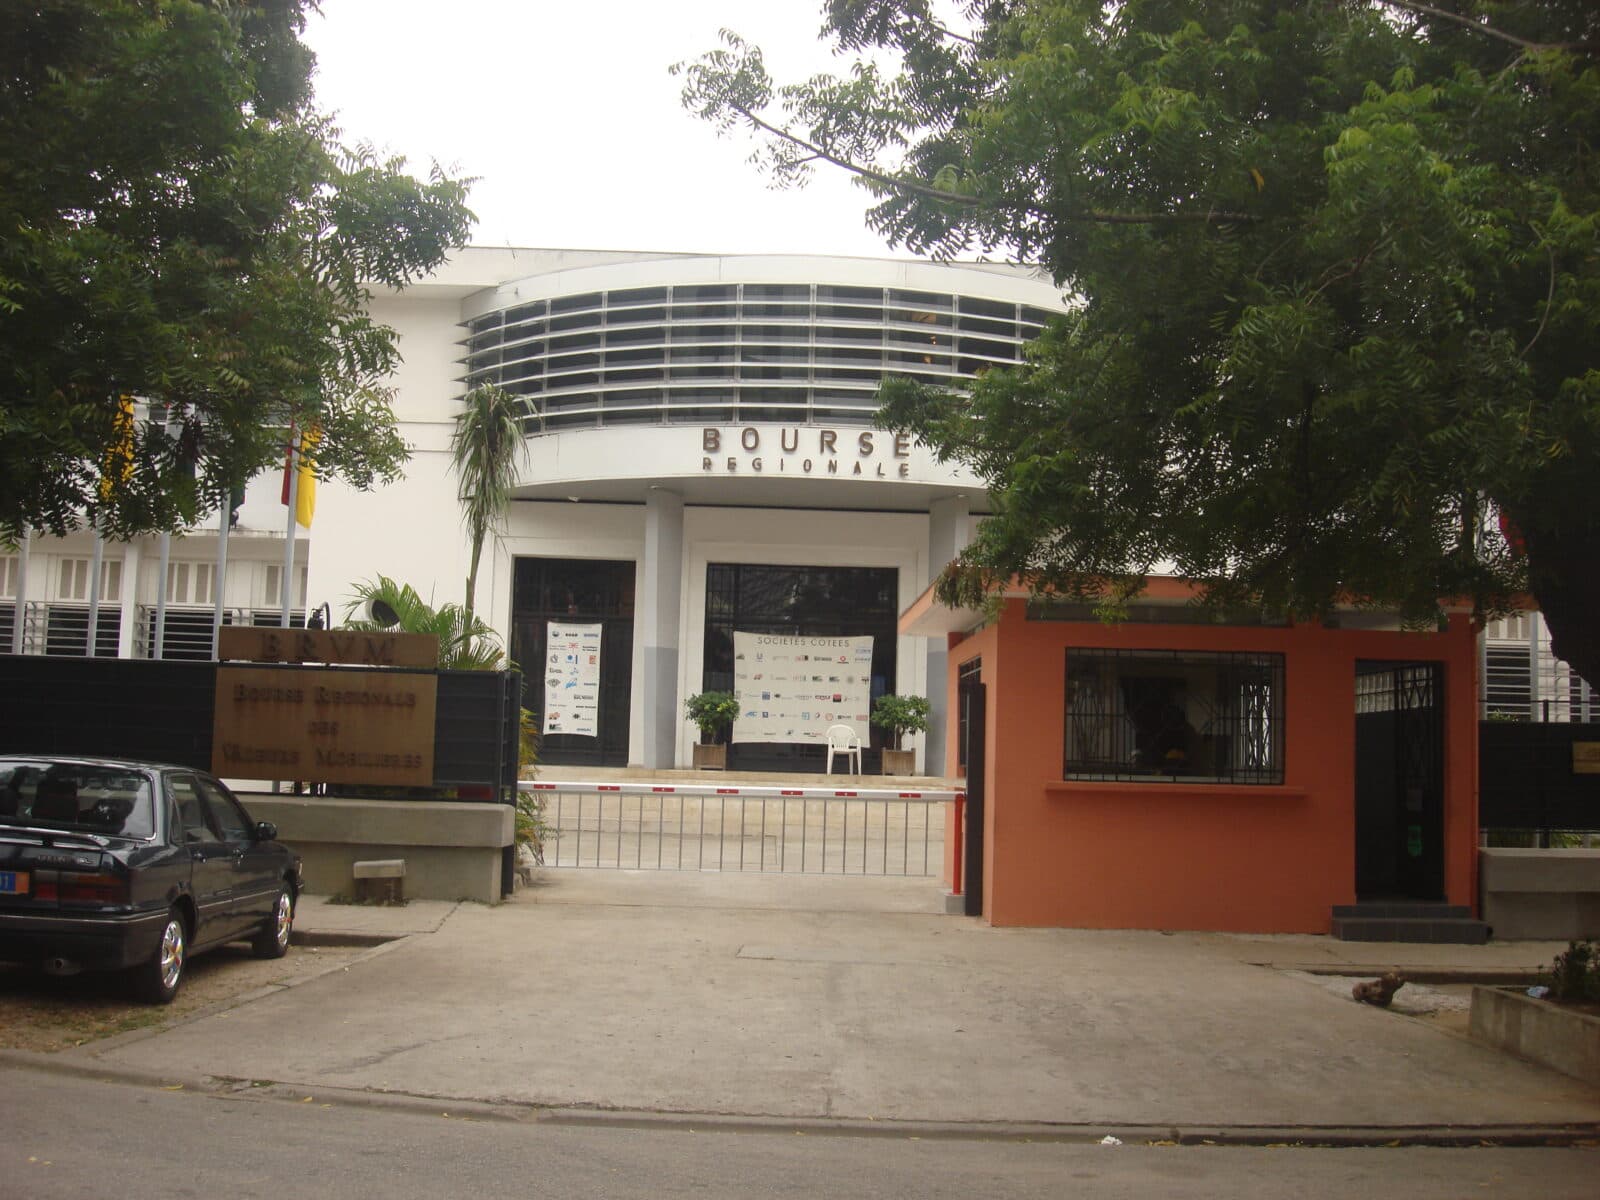
BRVM 30: BIIC and BOA Bénin included in the composition effective 1 October
The BRVM has published the list of the thirty securities in its index. It offers a reference point for distinguishing index membership from a stock's daily performance.
Bank of Africa Bénin share price▲ +86 % over the period
27 Oct 2026Open 9,080Close 9,300+2.54 %Vol. 2,751
Chart: TradingView Lightweight Charts
Source: BRVM, 27 October 2026.
| Period | Highest close | Lowest close | Change |
|---|---|---|---|
| 1 week | 9,300 | 9,000 | en hausse : +1,31 % |
| 1 month | 9,750 | 9,000 | en hausse : +3,91 % |
| Year to date | 10,350 | 5,845 | en hausse : +58,97 % |
| 1 year | 10,350 | 4,895 | en hausse : +86,00 % |
| 3 years | 10,350 | 3,150 | en hausse : +191,08 % |
| 5 years | 10,350 | 2,550 | en hausse : +247,66 % |
Change since the last close before the period. “–”: not enough history.
Subscribers
The overview of Bank of Africa Bénin is being prepared.
The BRVM has published the list of the thirty securities in its index. It offers a reference point for distinguishing index membership from a stock's daily performance.
The session on 9 October ends lower on the regional exchange. In Benin, BIIC loses 0.94% while Bank of Africa remains stable. The three main indices all close in the red.
| Financial year | Net dividend | Ex-dividend | Payment | Notice |
|---|---|---|---|---|
| 2025 | 585 FCFA | 22 May 2026 | 26 May 2026 | Notice |
| 2024 | 468 FCFA | 30 May 2025 | 3 June 2025 | Notice |
| 2023 | 706 FCFA | 23 May 2024 | 27 May 2024 | Notice |
| 2022 | 627 FCFA | 23 May 2023 | 25 May 2023 | Notice |
| 2021 | 546 FCFA | 23 May 2022 | 25 May 2022 | Notice |
| 2020 | 436 FCFA | 18 May 2021 | 20 May 2021 | Notice |
| 2019 | 436 FCFA | 13 May 2020 | 15 May 2020 | Notice |
| 2018 | 416 FCFA | – | 22 May 2019 | Notice |
| 2019 | 416 FCFA | 20 May 2019 | 22 May 2019 | Notice |
| 2017 | 407 FCFA | – | 15 May 2018 | Notice |
Net amounts per share. The ex-dividend date is the first day on which the share trades without entitlement to the dividend. Source : BRVM, avis et annonces des sociétés cotées (brvm.org).
PDF documents published on the BRVM website. Source: BRVM company announcements (brvm.org).
No executive has been listed yet.