Public policy · News
AfDB approves $144.34 million for Niger power reforms and arrears
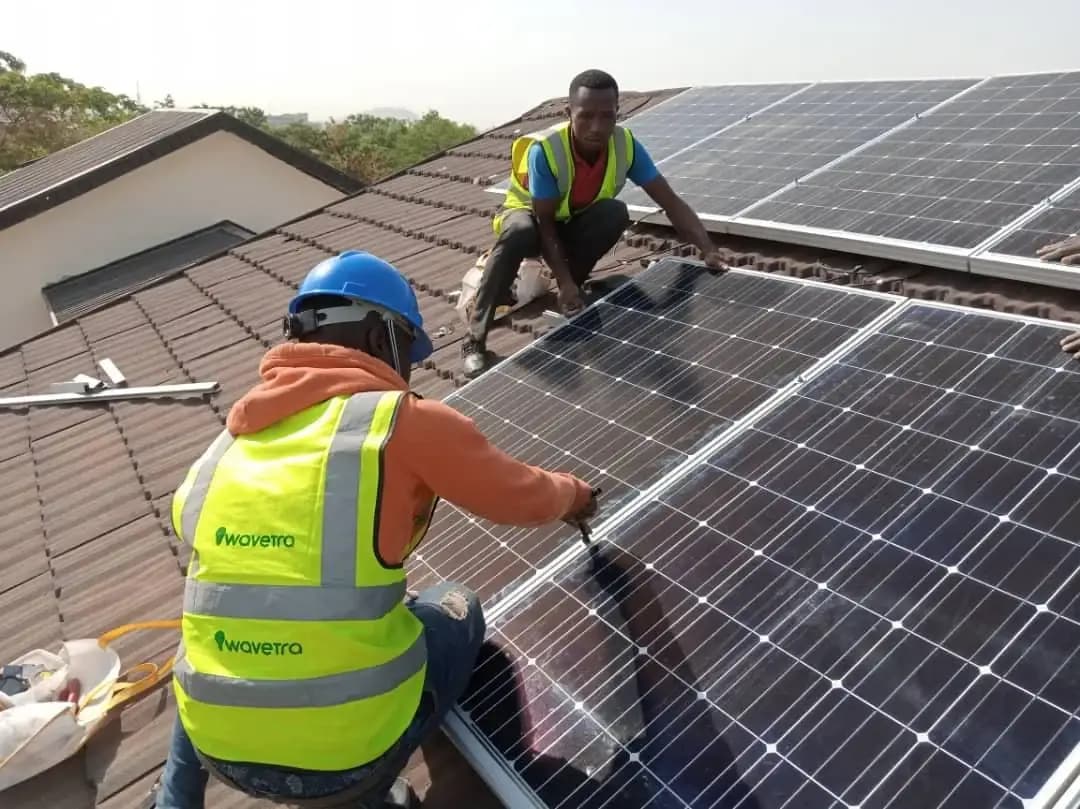
The loan will support the electricity code, rural electrification and payment of state claims owed to businesses. Approval does not amount to disbursement.
Country
BRVM closing prices sourced from sikafinance.com.
GDP growth
6.9%
2025 · 2026 : 7.0% (projection)
Inflation
-4.7%
2025 · 2026 : -1.9% (projection)
Public debt
45.5%
2025 · % of GDP · 2026 : 46.3% (projection)
Fiscal balance
-2.9%
2025 · % of GDP · 2026 : -3.4% (projection)
Current account balance
-3.7%
2025 · % of GDP · 2026 : -3.0% (projection)
Nominal GDP
21.3 bn USD
2025 · 2026 : 23.4 bn USD (projection)
GDP per capita
730 USD
2025 · 2026 : 774 USD (projection)
Population
27.9 million
2025
In %
Source: IMF World Economic Outlook
| Observed or estimated | IMF projection | |
|---|---|---|
| 2015 | 4.4 | – |
| 2016 | 5.7 | – |
| 2017 | 5 | – |
| 2018 | 7 | – |
| 2019 | 6.1 | – |
| 2020 | 3.5 | – |
| 2021 | 1.4 | – |
| 2022 | 11.9 | – |
| 2023 | 2.5 | – |
| 2024 | 8.3 | – |
| 2025 | 6.9 | 6.9 |
| 2026 | – | 7 |
| 2027 | – | 6.5 |
| 2028 | – | 6 |
| 2029 | – | 6 |
| 2030 | – | 6 |
| 2031 | – | 6 |
In %
Source: IMF World Economic Outlook
| Observed or estimated | IMF projection | |
|---|---|---|
| 2015 | 1 | – |
| 2016 | 0.2 | – |
| 2017 | 0.2 | – |
| 2018 | 2.8 | – |
| 2019 | -2.5 | – |
| 2020 | 2.9 | – |
| 2021 | 3.8 | – |
| 2022 | 4.2 | – |
| 2023 | 3.7 | – |
| 2024 | 9.1 | – |
| 2025 | -4.7 | -4.7 |
| 2026 | – | -1.9 |
| 2027 | – | 2 |
| 2028 | – | 2 |
| 2029 | – | 2 |
| 2030 | – | 2 |
| 2031 | – | 2 |
Sources: IMF World Economic Outlook (key figures, growth and inflation; estimates and projections from 2026); World Bank World Development Indicators (population and structural indicators). The latest available year is shown for each figure.
Public policy · News
The loan will support the electricity code, rural electrification and payment of state claims owed to businesses. Approval does not amount to disbursement.
Public policy · News
Companies · News
Public policy · News
Economy · Brief
Jobs and training · Brief
Economy · News
Public policy · News
Finance · News
Economy · News
Finance · News
Finance · News
Markets · News
Economy · News
Finance · Explainer