Companies · Brief
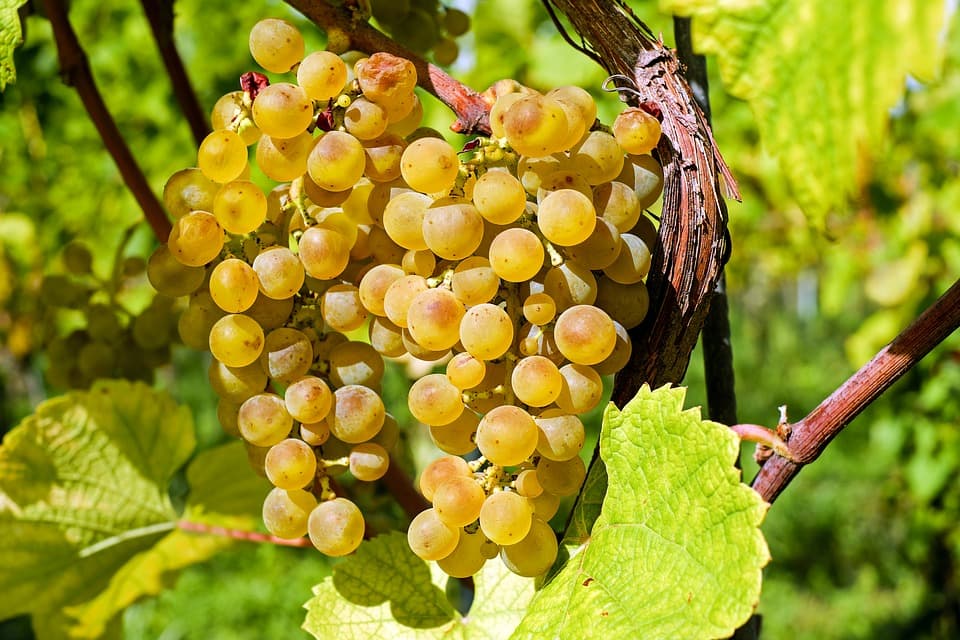
Burkina Faso creates SOVIB to produce wine locally
Planned in Bobo-Dioulasso, the industrial plant represents an estimated investment of nearly 10 billion CFA francs, separate from the company's initial capital of one billion.
Country
BRVM closing prices sourced from sikafinance.com.
GDP growth
5.3%
2025 · 2026 : 4.4% (projection)
Inflation
-0.5%
2025 · 2026 : 2.1% (projection)
Public debt
53.2%
2025 · % of GDP · 2026 : 51.0% (projection)
Fiscal balance
-1.5%
2025 · % of GDP · 2026 : -3.8% (projection)
Current account balance
+5.8%
2025 · % of GDP · 2026 : -0.6% (projection)
Nominal GDP
27.7 bn USD
2025 · 2026 : 32.4 bn USD (projection)
GDP per capita
1,150 USD
2025 · 2026 : 1,316 USD (projection)
Population
24.1 million
2025
In %
Source: IMF World Economic Outlook
| Observed or estimated | IMF projection | |
|---|---|---|
| 2015 | 3.9 | – |
| 2016 | 6 | – |
| 2017 | 6.2 | – |
| 2018 | 6.6 | – |
| 2019 | 5.9 | – |
| 2020 | 2 | – |
| 2021 | 6.9 | – |
| 2022 | 1.6 | – |
| 2023 | 3 | – |
| 2024 | 4.8 | – |
| 2025 | 5.3 | 5.3 |
| 2026 | – | 4.4 |
| 2027 | – | 4.8 |
| 2028 | – | 4.8 |
| 2029 | – | 4.8 |
| 2030 | – | 4.8 |
| 2031 | – | 4.9 |
In %
Source: IMF World Economic Outlook
| Observed or estimated | IMF projection | |
|---|---|---|
| 2015 | 1.7 | – |
| 2016 | 0.4 | – |
| 2017 | 1.5 | – |
| 2018 | 2 | – |
| 2019 | -3.2 | – |
| 2020 | 1.9 | – |
| 2021 | 3.9 | – |
| 2022 | 13.8 | – |
| 2023 | 0.9 | – |
| 2024 | 4.2 | – |
| 2025 | -0.5 | -0.5 |
| 2026 | – | 2.1 |
| 2027 | – | 2.2 |
| 2028 | – | 2 |
| 2029 | – | 2 |
| 2030 | – | 2 |
| 2031 | – | 2 |
Sources: IMF World Economic Outlook (key figures, growth and inflation; estimates and projections from 2026); World Bank World Development Indicators (population and structural indicators). The latest available year is shown for each figure.
Companies · Brief
Planned in Bobo-Dioulasso, the industrial plant represents an estimated investment of nearly 10 billion CFA francs, separate from the company's initial capital of one billion.
Jobs and training · Brief
Public policy · News
Economy · News
Finance · News
Finance · News
Markets · News
Public policy · News
Public policy · News
Finance · Explainer
Markets · News
Economy · News