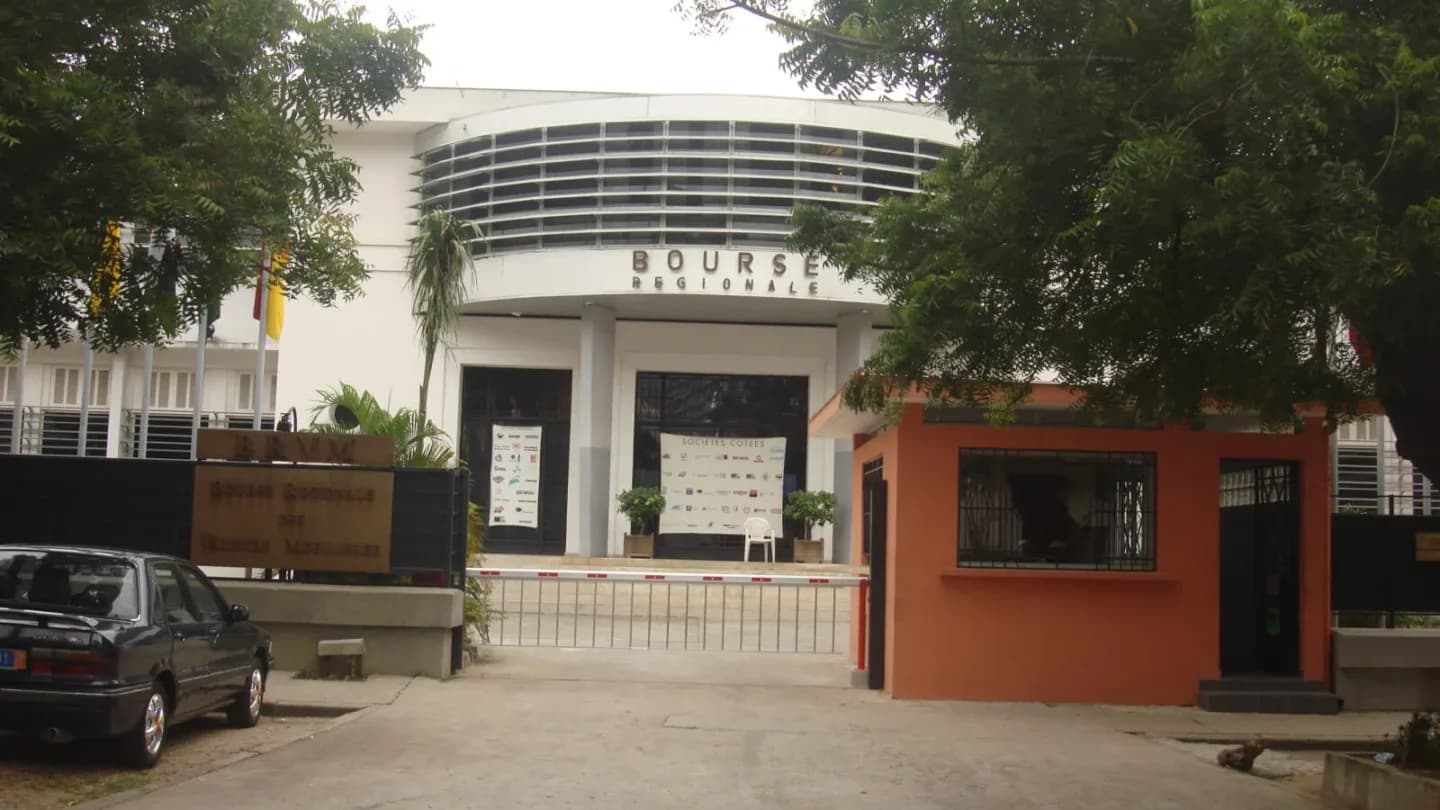
Oragroup Protects Profit as Cost of Risk Falls
Net banking income falls 1%, but lower cost of risk supports the earnings of the group listed on the BRVM.
Oragroup share price▲ +3.8 % over the period
27 Oct 2026Open 2,750Close 2,715−1.81 %Vol. 903
Source: BRVM, 27 October 2026.
| Period | Highest close | Lowest close | Change |
|---|---|---|---|
| 1 week | 2,800 | 2,715 | en baisse : −2,69 % |
| 1 month | 3,000 | 2,715 | en baisse : −10,98 % |
| Year to date | 3,995 | 2,435 | en hausse : +13,13 % |
| 1 year | 3,995 | 2,385 | en hausse : +3,82 % |
| 3 years | 3,995 | 1,550 | en hausse : +1,31 % |
| 5 years | 4,350 | 1,550 | en baisse : −33,78 % |
Change since the last close before the period. “–”: not enough history.
Subscribers
The overview of Oragroup is being prepared.
Net banking income falls 1%, but lower cost of risk supports the earnings of the group listed on the BRVM.
| Financial year | Net dividend | Ex-dividend | Payment | Notice |
|---|---|---|---|---|
| 2019 | 59.52 FCFA | 15 July 2020 | 17 July 2020 | Notice |
| 2018 | 56.73 FCFA | 27 June 2019 | 1 July 2019 | Notice |
Net amounts per share. The ex-dividend date is the first day on which the share trades without entitlement to the dividend. Source : BRVM, avis et annonces des sociétés cotées (brvm.org).
PDF documents published on the BRVM website. Source: BRVM company announcements (brvm.org).
No executive has been listed yet.