

The gross share of non-performing loans in the portfolios of banks and financial institutions in the WAEMU reaches 10.3% in September 2026, compared with 10.1% in August and 9.4% a year earlier. The statistical bulletin published by the BCEAO on 6 November makes it possible to measure this deterioration at regional level and in each of the eight countries.
Provisioning coverage fell in parallel to 58%, from 60.1% in September 2025. After impairments, the net deterioration rate rose from 4.1% to 4.6%. These indicators describe weakened loans and their accounting treatment. The November 2016 banking instruction includes restructured loans, as well as doubtful or disputed claims, in non-performing loans. It provides for impairment of probable losses and the write-off of irrecoverable loans.
Different trajectories from country to country
The regional movement covers diverging trajectories. In Niger, the gross rate falls to 23.6%, from 28.5% in September 2025. In Mali, by contrast, it rises from 12.8% to 15.8%. Niger's level therefore remains above Mali's, despite the improvement observed over twelve months.
Benin reports a gross rate of 5.5%, compared with 4.4% a year earlier. Burkina Faso follows a different path, with a decline from 11.6% to 11.1%. These ratios set gross non-performing loans against net customer loans plus impairments, which makes it possible to compare the quality of portfolios regardless of their absolute size.
In the other banking systems, the gross rate stands at 21% in Guinea-Bissau, 11.8% in Senegal, 10.2% in Togo and 7.5% in Côte d’Ivoire. The Union average therefore brings together national situations that are far apart from one another.
In %
Select a bar to see its details.
Table 2.2.9, row 1. Banks and financial institutions. Gross non-performing loans set against net customer loans plus impairments. Ratios rounded to one decimal place.
Source : BCEAO, bulletin mensuel des statistiques, September 2026
Download CSV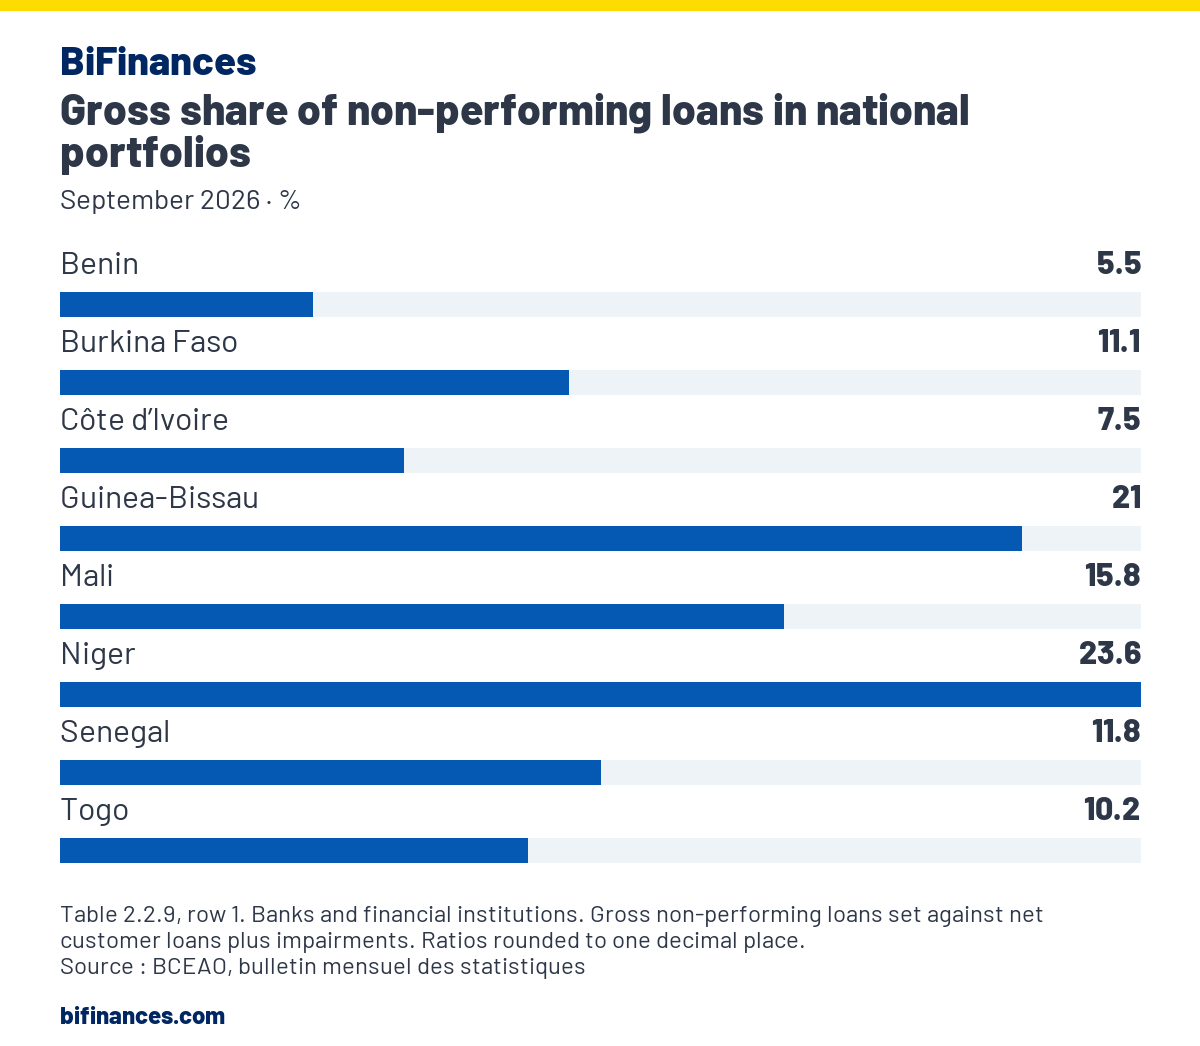
View data
| Category | % |
|---|---|
| Niger | 23.6 |
| Guinea-Bissau | 21 |
| Mali | 15.8 |
| Senegal | 11.8 |
| Burkina Faso | 11.1 |
| Togo | 10.2 |
| Côte d’Ivoire | 7.5 |
| Benin | 5.5 |
Differences also concern coverage of recognised risk. Provisions represent 71.1% of gross non-performing loans in Burkina Faso, compared with 38.2% in Benin. This indicator uses weakened loans as its denominator, whereas the deterioration rate measures their weight in the loan portfolio.