Finance · News
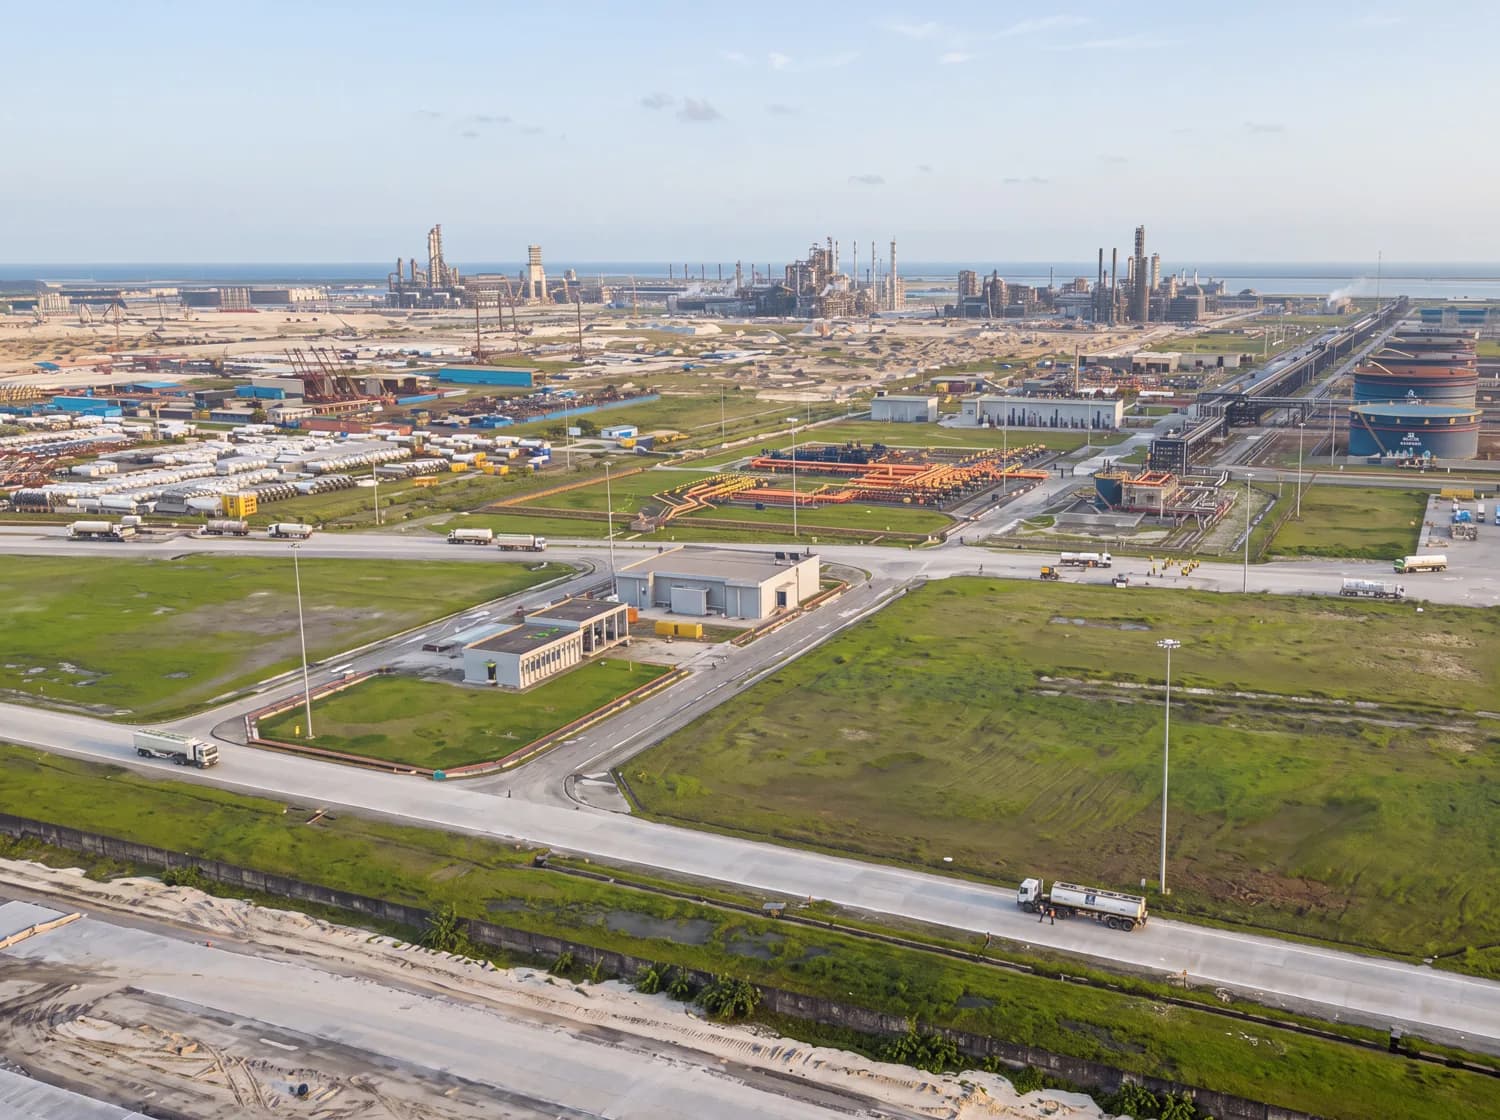
In Botswana, Access Bank offers Dangote certificates from 585 pulas
Investors can subscribe until 27 October for certificates backed by shares in the refinery. Listing in Gaborone is planned for 14 December, subject to conditions.
Country
GDP growth
-0.7%
2025 · 2026 : 4.4% (projection)
Inflation
2.8%
2025 · 2026 : 7.2% (projection)
Public debt
34.0%
2025 · % of GDP · 2026 : 40.3% (projection)
Fiscal balance
-6.1%
2025 · % of GDP · 2026 : -6.9% (projection)
Current account balance
+3.1%
2025 · % of GDP · 2026 : -1.0% (projection)
Nominal GDP
19.9 bn USD
2025 · 2026 : 22.1 bn USD (projection)
GDP per capita
7,802 USD
2025 · 2026 : 8,563 USD (projection)
Population
2.6 million
2025
In %
Source: IMF World Economic Outlook
| Observed or estimated | IMF projection | |
|---|---|---|
| 2015 | -4.9 | – |
| 2016 | 7.2 | – |
| 2017 | 4.1 | – |
| 2018 | 4.2 | – |
| 2019 | 3 | – |
| 2020 | -8.7 | – |
| 2021 | 11.9 | – |
| 2022 | 5.5 | – |
| 2023 | 3.2 | – |
| 2024 | -2.8 | – |
| 2025 | -0.7 | -0.7 |
| 2026 | – | 4.4 |
| 2027 | – | 2.2 |
| 2028 | – | 3 |
| 2029 | – | 3.9 |
| 2030 | – | 3.9 |
| 2031 | – | 4 |
In %
Source: IMF World Economic Outlook
| Observed or estimated | IMF projection | |
|---|---|---|
| 2015 | 3.1 | – |
| 2016 | 2.8 | – |
| 2017 | 3.3 | – |
| 2018 | 3.2 | – |
| 2019 | 2.7 | – |
| 2020 | 1.9 | – |
| 2021 | 6.7 | – |
| 2022 | 12.2 | – |
| 2023 | 5.1 | – |
| 2024 | 2.8 | – |
| 2025 | 2.8 | 2.8 |
| 2026 | – | 7.2 |
| 2027 | – | 7.4 |
| 2028 | – | 4.4 |
| 2029 | – | 4.4 |
| 2030 | – | 4.5 |
| 2031 | – | 4.5 |
Sources: IMF World Economic Outlook (key figures, growth and inflation; estimates and projections from 2026); World Bank World Development Indicators (population and structural indicators). The latest available year is shown for each figure.
Finance · News
Investors can subscribe until 27 October for certificates backed by shares in the refinery. Listing in Gaborone is planned for 14 December, subject to conditions.
Public policy · News
Companies · News