Economy
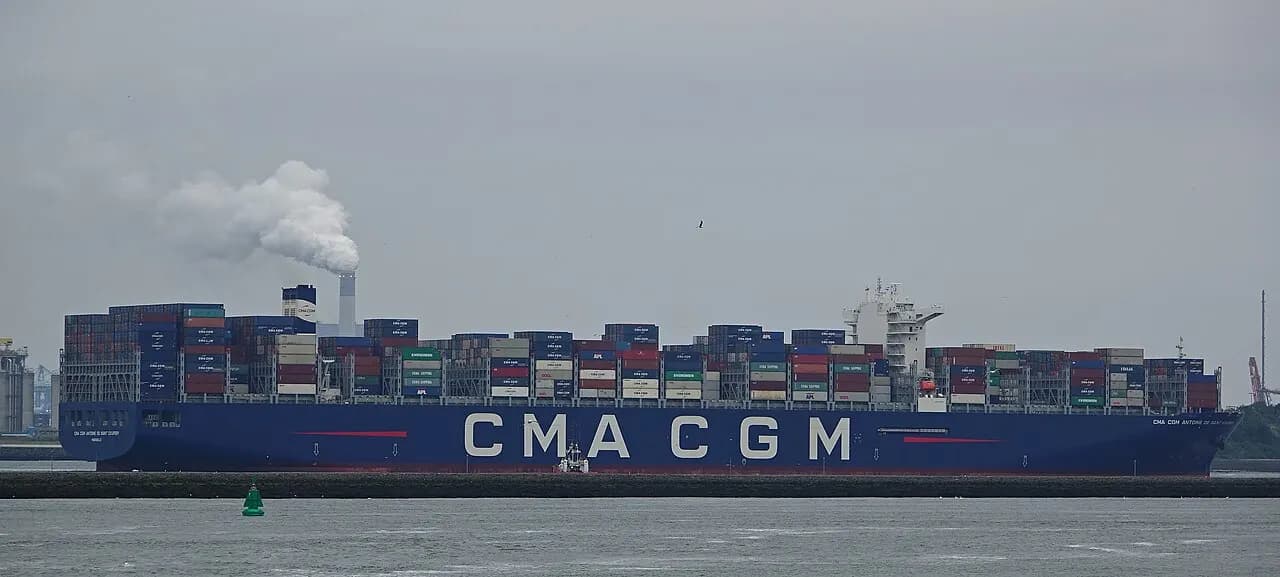
CMA CGM: $350 per TEU surcharge on shipments from China to six African countries
Effective for cargo loaded from 22 October, the peak-season charge applies to short-term freight contracts bound for Benin and five other African markets.
Country
GDP growth
-5.8%
2025 · 2026 : -1.7% (projection)
Inflation
2.3%
2025 · 2026 : 3.3% (projection)
Public debt
35.4%
2025 · % of GDP · 2026 : 32.9% (projection)
Fiscal balance
-0.6%
2025 · % of GDP · 2026 : -0.6% (projection)
Current account balance
-2.4%
2025 · % of GDP · 2026 : -0.1% (projection)
Nominal GDP
12.8 bn USD
2025 · 2026 : 14.3 bn USD (projection)
GDP per capita
7,850 USD
2025 · 2026 : 8,484 USD (projection)
Population
1.9 million
2025
In %
Source: IMF World Economic Outlook
| Observed or estimated | IMF projection | |
|---|---|---|
| 2015 | -9.1 | – |
| 2016 | -8.8 | – |
| 2017 | -5.7 | – |
| 2018 | -6.2 | – |
| 2019 | -5.5 | – |
| 2020 | -4.8 | – |
| 2021 | 0.9 | – |
| 2022 | 3.2 | – |
| 2023 | -7.4 | – |
| 2024 | 0.4 | – |
| 2025 | -5.8 | -5.8 |
| 2026 | – | -1.7 |
| 2027 | – | -1 |
| 2028 | – | 1.6 |
| 2029 | – | 2.2 |
| 2030 | – | 2.5 |
| 2031 | – | 2.3 |
In %
Source: IMF World Economic Outlook
| Observed or estimated | IMF projection | |
|---|---|---|
| 2015 | 1.6 | – |
| 2016 | 1.4 | – |
| 2017 | 0.8 | – |
| 2018 | 1.4 | – |
| 2019 | 1.2 | – |
| 2020 | 4.8 | – |
| 2021 | -0.1 | – |
| 2022 | 4.9 | – |
| 2023 | 2.4 | – |
| 2024 | 3.4 | – |
| 2025 | 2.3 | 2.3 |
| 2026 | – | 3.3 |
| 2027 | – | 2.9 |
| 2028 | – | 2.6 |
| 2029 | – | 2.5 |
| 2030 | – | 2.5 |
| 2031 | – | 2.5 |
Sources: IMF World Economic Outlook (key figures, growth and inflation; estimates and projections from 2026); World Bank World Development Indicators (population and structural indicators). The latest available year is shown for each figure.
Most frequently cited together in our latest 15 articles about Equatorial Guinea.
Economy
Effective for cargo loaded from 22 October, the peak-season charge applies to short-term freight contracts bound for Benin and five other African markets.
Finance · News
Public policy · News
Economy · News
Public policy · News
Companies · News
Companies · News
Economy · News
Finance · News
Economy · News
Finance · News
Finance · News
Finance · Brief