Economy · News
Marampa Mines announces temporary suspension of operations in Sierra Leone
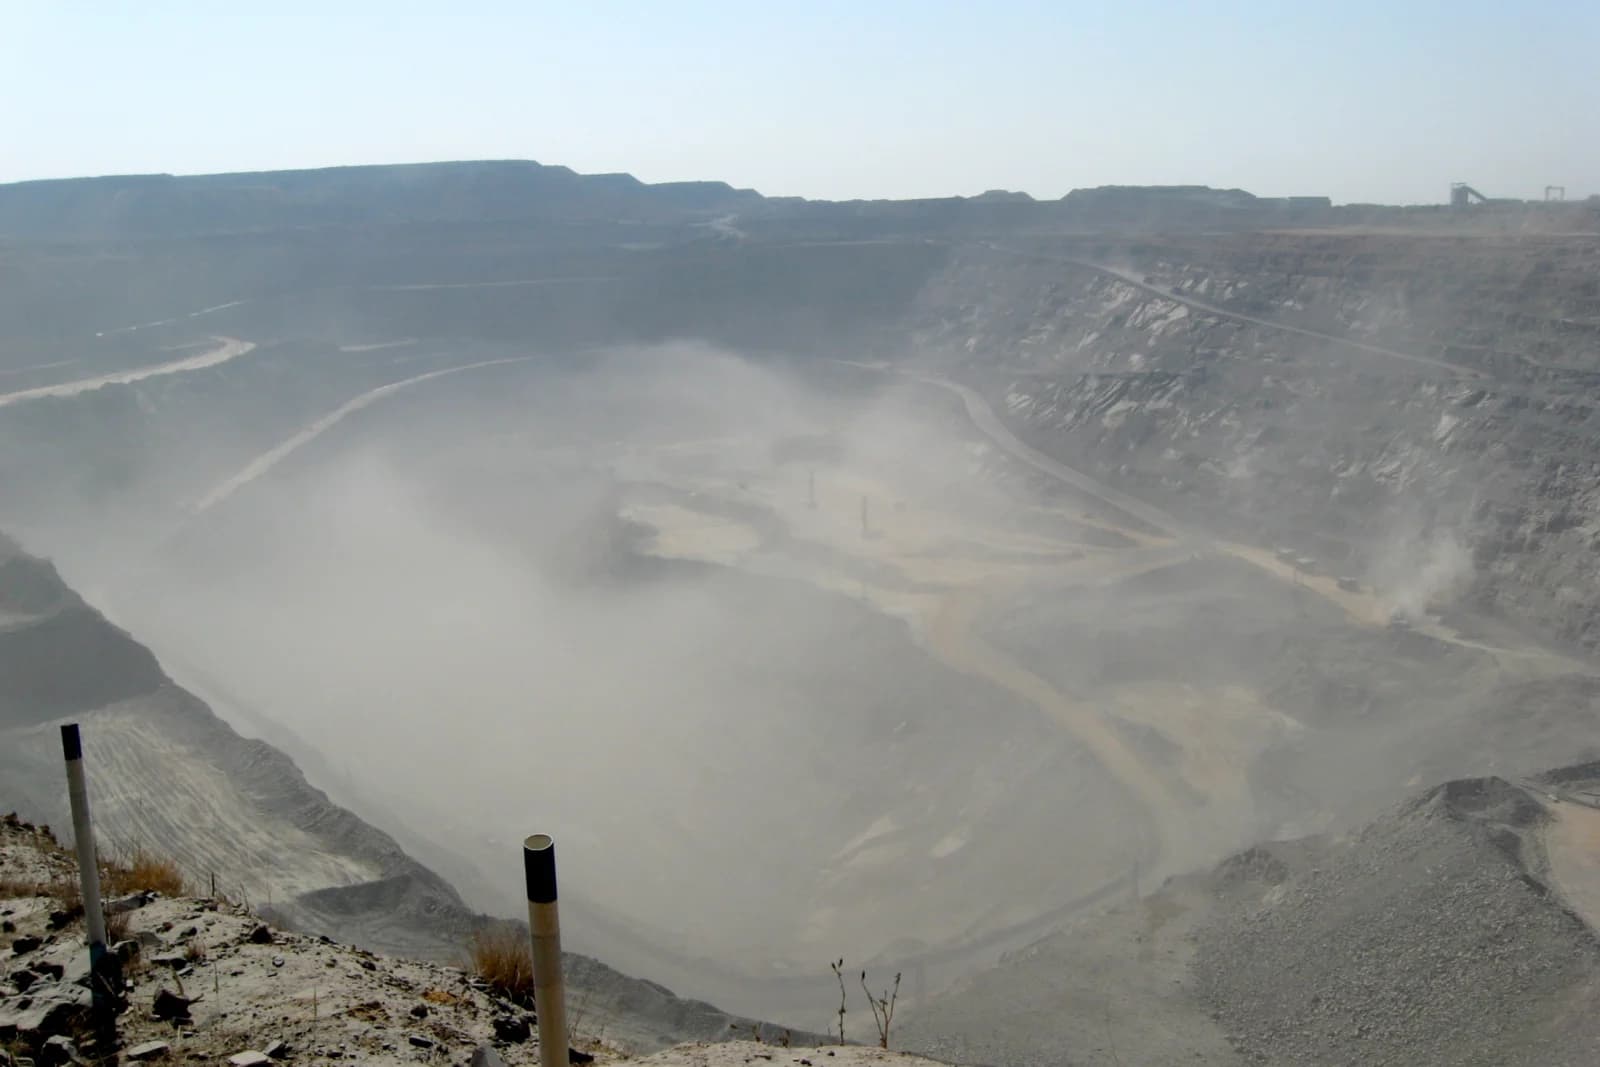
The operator of the Marampa iron ore deposit cited weak markets and high freight and operating costs. It has not given a shutdown date.
Country
GDP growth
4.8%
2025 · 2026 : 4.0% (projection)
Inflation
7.6%
2025 · 2026 : 13.8% (projection)
Public debt
51.4%
2025 · % of GDP · 2026 : 50.1% (projection)
Fiscal balance
-4.2%
2025 · % of GDP · 2026 : -2.9% (projection)
Current account balance
-5.2%
2025 · % of GDP · 2026 : -4.7% (projection)
Nominal GDP
7.7 bn USD
2025 · 2026 : 8.5 bn USD (projection)
GDP per capita
874 USD
2025 · 2026 : 946 USD (projection)
Population
8.8 million
2025
In %
Source: IMF World Economic Outlook
| Observed or estimated | IMF projection | |
|---|---|---|
| 2015 | -3.1 | – |
| 2016 | 4.7 | – |
| 2017 | 3.9 | – |
| 2018 | 3.4 | – |
| 2019 | 5.5 | – |
| 2020 | -1.3 | – |
| 2021 | 5.9 | – |
| 2022 | 5.3 | – |
| 2023 | 5.7 | – |
| 2024 | 4.6 | – |
| 2025 | 4.8 | 4.8 |
| 2026 | – | 4 |
| 2027 | – | 4.4 |
| 2028 | – | 4.6 |
| 2029 | – | 4.6 |
| 2030 | – | 4.6 |
| 2031 | – | 4.6 |
In %
Source: IMF World Economic Outlook
| Observed or estimated | IMF projection | |
|---|---|---|
| 2015 | 6.7 | – |
| 2016 | 10.9 | – |
| 2017 | 18.2 | – |
| 2018 | 16 | – |
| 2019 | 14.8 | – |
| 2020 | 13.4 | – |
| 2021 | 11.9 | – |
| 2022 | 27.2 | – |
| 2023 | 47.7 | – |
| 2024 | 28.4 | – |
| 2025 | 7.6 | 7.6 |
| 2026 | – | 13.8 |
| 2027 | – | 13 |
| 2028 | – | 9.3 |
| 2029 | – | 9 |
| 2030 | – | 9 |
| 2031 | – | 9 |
Sources: IMF World Economic Outlook (key figures, growth and inflation; estimates and projections from 2026); World Bank World Development Indicators (population and structural indicators). The latest available year is shown for each figure.
Economy · News
The operator of the Marampa iron ore deposit cited weak markets and high freight and operating costs. It has not given a shutdown date.