Jobs and training · Brief
South Sudan’s central bank announces cash salary payments
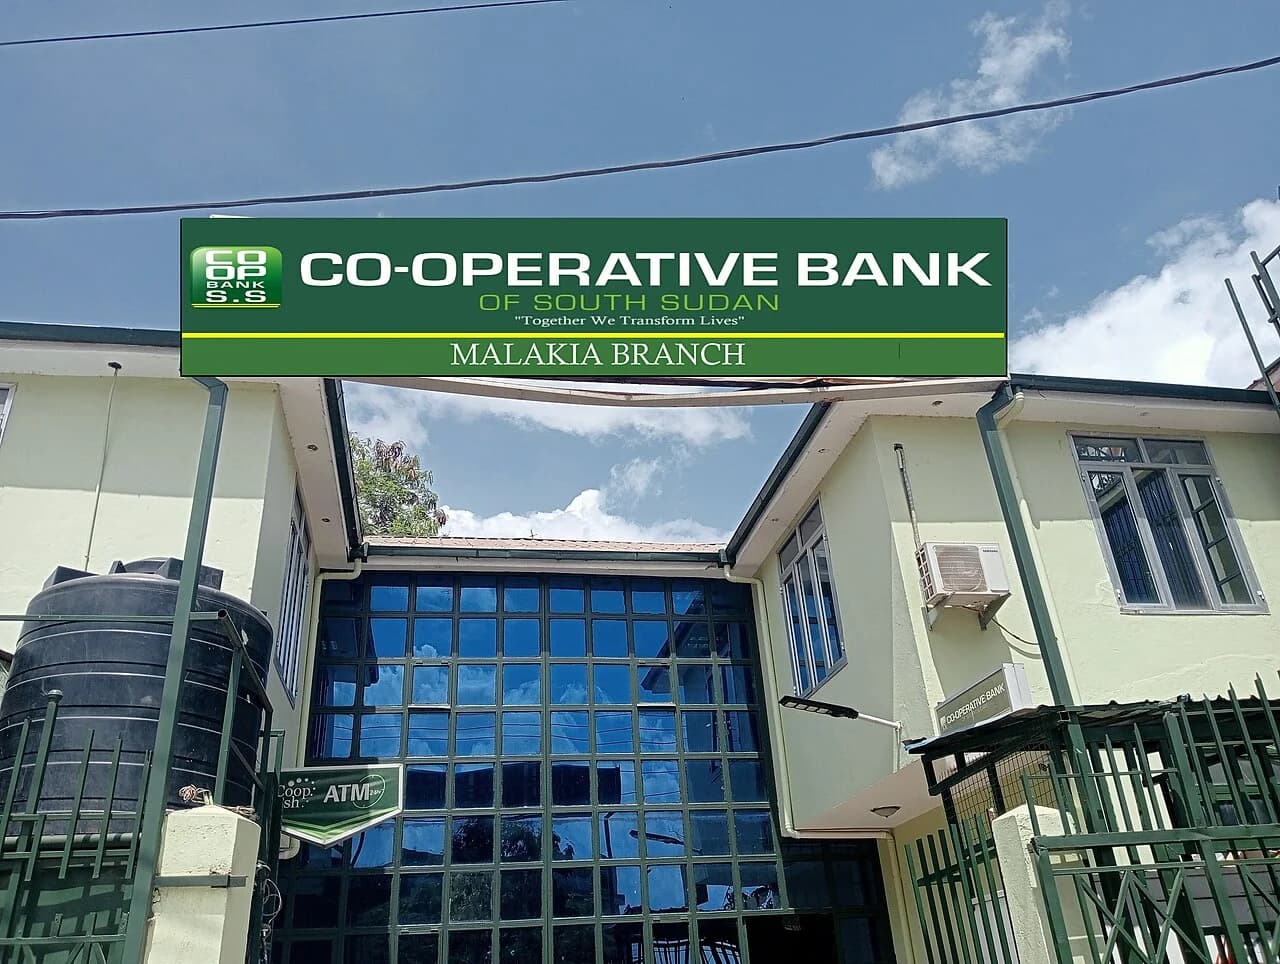
Civil servants are asked to go to their respective banks. The notice of 19 October does not specify the pay period concerned.
Country
GDP growth
41.4%
2025 · 2026 : 10.5% (projection)
Inflation
97.6%
2025 · 2026 : 27.6% (projection)
Public debt
64.2%
2025 · % of GDP · 2026 : 43.2% (projection)
Fiscal balance
+3.3%
2025 · % of GDP · 2026 : -0.3% (projection)
Current account balance
-6.4%
2025 · % of GDP · 2026 : +8.2% (projection)
Nominal GDP
5.5 bn USD
2025 · 2026 : 8.0 bn USD (projection)
GDP per capita
454 USD
2025 · 2026 : 642 USD (projection)
Population
12.2 million
2025
In %
Source: IMF World Economic Outlook
| Observed or estimated | IMF projection | |
|---|---|---|
| 2015 | -0.2 | – |
| 2016 | -13.3 | – |
| 2017 | -5.8 | – |
| 2018 | -2.1 | – |
| 2019 | 0.9 | – |
| 2020 | -6.5 | – |
| 2021 | 5.3 | – |
| 2022 | -5.2 | – |
| 2023 | 5.3 | – |
| 2024 | -28.1 | – |
| 2025 | 41.4 | 41.4 |
| 2026 | – | 10.5 |
| 2027 | – | 3.9 |
| 2028 | – | 3.5 |
| 2029 | – | 3.3 |
| 2030 | – | 3.6 |
| 2031 | – | 2.9 |
In %
Source: IMF World Economic Outlook
| Observed or estimated | IMF projection | |
|---|---|---|
| 2015 | 53 | – |
| 2016 | 346.1 | – |
| 2017 | 213 | – |
| 2018 | 83.4 | – |
| 2019 | 49.3 | – |
| 2020 | 24 | – |
| 2021 | 30.2 | – |
| 2022 | -3.2 | – |
| 2023 | 39.7 | – |
| 2024 | 99.8 | – |
| 2025 | 97.6 | 97.6 |
| 2026 | – | 27.6 |
| 2027 | – | 28.3 |
| 2028 | – | 7.8 |
| 2029 | – | 6.3 |
| 2030 | – | 5.6 |
| 2031 | – | 5 |
Sources: IMF World Economic Outlook (key figures, growth and inflation; estimates and projections from 2026); World Bank World Development Indicators (population and structural indicators). The latest available year is shown for each figure.
Jobs and training · Brief
Civil servants are asked to go to their respective banks. The notice of 19 October does not specify the pay period concerned.
Economy · News